Climate Just: supporting equitable responses to climate change through social vulnerability maps
By Professor Sarah Lindley, Co-Investigator of the Digital Solutions Hub
Historical carbon emissions are already locked into the climate system. Furthermore, there is increasing evidence that associated impacts now persist, through extreme weather, climate-related events like floods and wildfires, or longer-term changes to the environment and biosphere. We must give urgent attention to tackling current and future emissions, but it is also vital to ensure that we are well adapted and prepared for the unavoidable changes ahead. Here, Professor Sarah Lindley, considers how the severity of climate change impacts differs between people and communities as a result of social vulnerability.
- In recent years, 77% of neighbourhoods have typically experienced weather hot enough to lead to excess heat-related mortality. However, not all people are affected equally.
- The Climate Just updated mapping tool and its wider resources enable policymakers to investigate geographical distributions of social vulnerability indicators (i.e. age, ill health) alongside maps for flooding or hot weather.
- Policymakers can combine information from Climate Just with in-house data and local community insight, catalysing limited resource to develop more effective, targeted and equitable adaptation measures.
Climate impacts: not all people affected equally
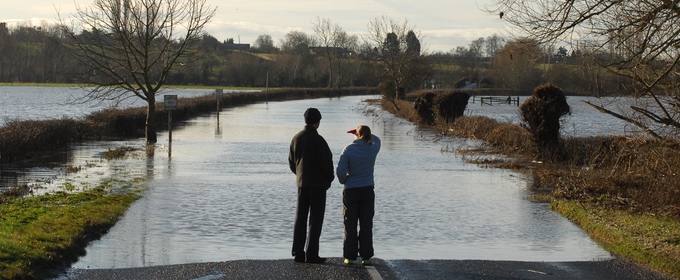
When we think about climate impacts, we often think about where floods might happen or temperatures peak. Whilst important, this information is only one sort of data needed to understand where the most significant harms might be felt. For example, not everyone is affected by a heatwave in the same way or to the same extent. In some communities there are higher proportions of people who are biophysically sensitive to the impacts of high temperatures due to their age (both the very young and old), their health and/or the medications they are taking. These people cannot regulate temperatures as well and are therefore more susceptible to dehydration and heat-stress.
Data are thus imperative in understanding how the severity of impacts might differ between people and communities whilst helping us to understand implications for organisations, service-providers and the systems we rely on. Data are also important in helping with decisions on responses. Effective adaptation is not a one-size-fits-all solution, but a complex set of responses which need to be tailored to specific – often local – needs.
Take social vulnerability to heat for example. In England, 77% of neighbourhoods have typically experienced weather hot enough to lead to detectable excess heat-related mortality. The proportion that will be exposed to this, and even hotter weather, increases every year as global temperatures warm.
Individual, social, economic and environmental factors all affect social vulnerability and can be intertwined. For example, people who are socially isolated have fewer people checking on their wellbeing during hot weather. If they live in rented accommodation, or are on a low income, they may be unable to adapt their homes, such as with shutters or blinds, even if they wish to. If we then consider that some homes, like high rises, do not have gardens or nearby greenspace and tend to overheat, it is clear that additional environmental factors are in play. All of these factors can combine to make the potential for harm particularly acute in some neighbourhoods compared to others.
Moreover, low incomes affect the ability of people to purchase insurance to protect themselves from losses associated with flooding, and in some communities with high levels of transience and population change there may also be less local knowledge about the extent of flood problems. In these cases, it can be vitally important that support services are in place to improve awareness, provide help and channel resources. Without such actions, inequalities can become persistent with ongoing and long-term impacts on health and wellbeing.
Climate Just
Researchers at The University of Manchester have been working to update data resources and mapping functions in Climate Just, an online resource and mapping tool originally launched in 2015. It enables policymakers, practitioners and council officials to investigate geographical distributions of individual indicators such as age and ill health, and assess composite maps which show sensitivity, ability to prepare, ability to respond, ability to recover, and exposure of the population in specific areas.
Layered on top of these maps are indicators of the potential hazards themselves, such as the potential for flooding or extreme temperatures. Taken together, maps of social vulnerability and hazard-exposure give an idea of the distribution of climate disadvantage across parts of the UK at a local neighbourhood level. Measures of climate disadvantage are important. They account for both the severity of potential climate-related hazards and the individual, social and environmental factors which either increase the potential for harm or offset it. The maps help to differentiate communities where exposure to floods or extreme heat might be similar, but where one community has a greater comparative vulnerability. They identify the sorts of vulnerabilities present, how they are combined and how they compare.
Focussing resources on people and communities who face the greatest potential for harm makes sense. Not only will these people and communities suffer less in the event of a flood or heatwave, but there will be fewer collective burdens on society in the days, months and years which follow. A socially-just response to climate change adaptation is a practical and efficient choice as well as an ethical one.
The new version of the Climate Just map tool has been supported by the Digital Solutions Hub. Free to use, it provides updated datasets and new functionality. Users can explore our comprehensive, quantitative, and accessible evidence base, case studies and guidance to support more socially-just decision-making.
Policy recommendations
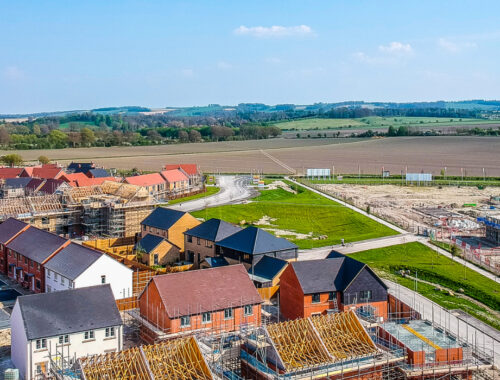
Local Government Officials, Government Departments and service-providers responsible for the resilience of our communities should make use of the data available on Climate Just to inform their strategic planning, so that the finite resources available to them are targeted at the areas of greatest need. This might include supporting investment decisions targeted at more socially vulnerable and climate disadvantaged communities, such as retrofitting of homes, so they are fit for future extremes. They should also consider partnership with other service providers and support the development of social infrastructure, like community groups and networks.
Policymakers should also understand that datasets are not perfect and that there will be gaps, which can only be supplemented by local information and further research. The combination of public and organisational engagement along with the data and tools available on Climate Just, should ensure that robust localised solutions are developed which allow for an effective response to future impacts of climate change. Such efficacy is possible despite the ever-developing ongoing research into the complexities and connectedness of social vulnerability and how these can be measured.
It is recommended that all organisations involved in developing adaptations to address social vulnerabilities engage with extended audiences. The maps and data contained on Climate Just have already proved to be a very useful communication tool helping to bring people together and provide a foundation for fruitful discussion. Wider engagement fosters a better appreciation of the wide range of ways that climate change can impact different people in different circumstances and helps to start the conversation with those affected, both directly and indirectly so that actions can be shared and gaps identified that agencies may need to fill.
Originally published by Policy@Manchester, The University of Manchester’s policy engagement unit.


You May Also Like
Harnessing Digital Solutions for Sustainable Housing Expansion: A GIS-Powered Approach
17 October 2024
The DSH attends the Public Sector Data and AI Summit 24
26 March 2024